Grade 5:
mean and mode
discrete and continuous data (knowing the difference)
collecting and organizing data into graphs (bar graphs and broken line graphs)
describing trends in a graph
Grade 6:
mean, median, mode and range
discrete and continuous data (knowing the difference)
collecting and organizing data into graphs (double bar graphs and continuous line graphs)
describing trends in a graph
Sample Questions:
1. The weekly salaries of six employees at McDonalds are $140, $220, $90, $180, $140, $200.
For these six salaries, find: (a) the mean (b) the median [grade 6 only] (c) the mode (d) the range [grade 6 only]
2. Andy has grades of 84, 65, and 76 on three math tests. What grade must he obtain on the next test to have an average of exactly 80 for the four tests? [grade 6 only]
3. Test scores for a class of 10 students are as follows:
93, 84, 97, 98, 100, 78, 86, 100, 85, 92 [grade 5 only]
a) Is this data discrete or continuous?
b) Display these results in a broken line graph.
c) What is the mean and mode?
4. Describe whether the following data sets would be considered discrete or continuous.
a) measuring the temperature outside every day for a month. __________________
b) counting the votes in a federal election. __________________
c) how many girls are at your school? __________________
d) calculate the time it took 10 runners to complete the marathon. __________________
5. Use a double bar graph to display the data below. [grade 6 only]

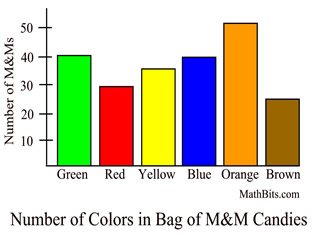
6. a) Using the graph below draw some conclusions about the data.
b) What is the scale?
No comments:
Post a Comment